
Assessments of Introducing New Technologies in Disaster Prevention Planning
ACM Subject Categories
Computing methodologies~Model verification and
            validation
Keywords
- Social Simulation
- Decision Support
- Evacuation Guidance
Abstract
Simulations have been used in multiple fields. Social simulation, in which humans play a major role in simulated scenarios, is one of the most promising fields in research. Human behavior is difficult to mathematically formulate. This makes it challenging to determine how well simulations mimic real situations; confirming simulation results empirically is also difficult. In this study, we present a new device that could change human behavior and provide a good method for mitigating damages during emergencies. We also consider ways of validating the simulation results to assess the new technology adoption.
Introduction
Disasters may occur anywhere at any time. In the past, we have been preparing for disasters in order to reduce the damage caused by them (World Health Organization [WHO], 2002). Weather forecast is one of the most common methods to foresee and plan for disasters such as heavy rainfall, typhoon, earthquakes, and other natural occurrences. The forecast is used to predict weather that may affect human life. Conditions under which disasters occur are wide-ranging; in the case of typhoons, news of a typhoon is announced a few days prior, while alerts on earthquakes are announced minutes before they occur at most. Prevention planning is executed to save lives during foreseen disasters, and drills are performed to improve the effectiveness of plans.
Plans for disasters are designed to be equivalent to the most extreme cases of past disasters, or worse ones. It is ideal to perform drills in the assumed situations. However, even statutory training in real situations can create risks, especially for disabled people and some vulnerable groups. For example, a university in Nairobi, Kenya executed an anti-terror exercise without announcing it was a drill. People believed it was real and several of them jumped from the windows of the university buildings and were injured (BBC News, 2015). Therefore, drills are executed at least under the basic condition that participants know it is a drill.
Computer simulations enable the examination of new scenarios that have not occurred in the real world. Social simulation, in which human behavior plays a major role in the simulated scenarios, is one of the most promising fields of simulation. Humans behave individually during emergencies; this behavior is difficult to mathematically formulate effectively. Therefore, it is challenging to determine how well simulations mimic real world situations. The development of Information Technology (IT) has inspired the introduction of new means to provide information to the public, especially travelers, and change human behavior to mitigate damages during emergencies (Federal Highway Administration [FHA], 2007).
An agent-based simulation system (ABSS) can simulate the behaviors of people in unusual scenarios that are difficult to test in the real world. People activities and movements have been simulated and studied in various fields including computer graphics, movie special effects, and evacuation. For example, the influence of the existence of authority figures or agent characters on the evacuation behaviors was simulated (Song, 2017; Song, 2016; Okaya & Toakahashi, 2011). However, the results of simulations were not verified as pointed out, unlike physics-based models, models and results of social simulations are not readily verified through observation of real-world events or empirical testing (Hahn, 2013). The human behavior in the simulations has been modeled using the reports on target fields (Hawe, Coates, Wilson, & Crouch, 2012).
In this paper, we discuss ways to assess a new method of evacuating people in life-threatening situations by simulation. The field of evacuation considers the case that humans are a component of the system. The remainder of this paper is set out as follows: In Section 2, the steps to model phenomena in the real world are presented. Section 3 describes a new evacuation guidance system using digital promotional signage (𝑃𝑆) that has been recently used in public and commercial areas. The effects of evacuation guidance on human evacuation flow control are tested using simulation, and the experimental results are discussed. In Section 4, the ways of assessment of simulation results are discussed. Section 5 provides a descriptive summary of our paper.
Physical Simulation and Social Simulation
Modeling Phenomena and Framework of Simulation
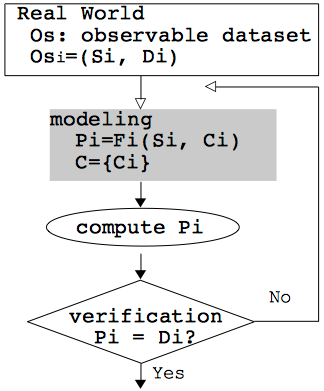
Simulations have been used in many fields for various purposes. The application fields are categorized into three classes: the first class consists of fields that are governed by scientific laws, the second class consists of fields that are related with humans. The human behaviors are not easily mathematically formulated but are represented in terms of text or data in documents. The third class is a combination of the first and the second. Figure 1 shows a process of modeling phenomena that belong in the first class. The phenomena are observed and represented as 𝐷 𝑠𝑖 = (𝑠𝑖, 𝑑𝑖) where 𝑑𝑖 is the data of the 𝑖th observation at situation 𝑠𝑖. Modeling of phenomena involves extracting parameters 𝑐𝑖 and the relationships among them, 𝐹𝑖 calculates the phenomena from 𝐷𝑠𝑖 and the validity is checked. To check validity, we determine whether the derived outputs from 𝐹𝑖 correspond to observed data, 𝑑𝑖 (Faraday, 1848).
An example of the first class is physics. Physics is an empirical science and physical laws have been derived based on the principle: guess → compute consequence → compare experiment. When new phenomena are observed, more specific laws are developed by adding new parameters, reformulating relationships between them, and so on to achieve higher reliability (Feynman, 1967). The simulation results are used in fields within the applicable scope of the physical laws.
Humans are a key component of social activities. These activities are the target field of classes two and three that we discussed earlier. Human behaviors that are described in texts or are documented as audio recording are implemented in simulations. The use of agent technology provides a platform to simulate social phenomena arising from the human activities (i.e., micro-behavior). The micro-specific approach has been accepted to solve complex real-world problems in various areas. For example, Jennings proposed a framework called Social Level, in which multi-agent systems (MAS) are targeted at systems composed of societies (Jennings, 1999). The society possesses the following components:
-
Members: entities performing the problem solving,
-
Environment: where members are situated,
-
Means of interaction: the ways members interact, and
-
Goals: a motivational force that drives problem solving among members.
The modeling process for the second and the third classes of applications essentially follows the modeling process displayed in Figure 1. However, each member’s autonomous behaviors and interactions with other members are different because of the diversity of culture and generation. The diversity makes it difficult to verify and validate the results (Heath, Hill, & Ciarallo, 2009).
Social Simulation to Prepare Prevention Planning for Disasters
Emergency situations arise from various causes and people behave differently during emergencies; for example, when there is an alarm to evacuate immediately, some people evacuate instantly and others may evacuate only after finishing their tasks. Various disasters such as fires, floods, typhoons, earthquakes, etc., occur at situations of different size, occurrence times, and so on. Kitano et al. (1999) proposed a MAS-based social simulation platform, RoboCup Rescue Simulation (RCRS) to support rescue activities during disastrous situations. Figure 2 shows the modeling process and the flowchart of simulators that can simulate disaster situations in various cases and scenarios (Takahashi, 2009).
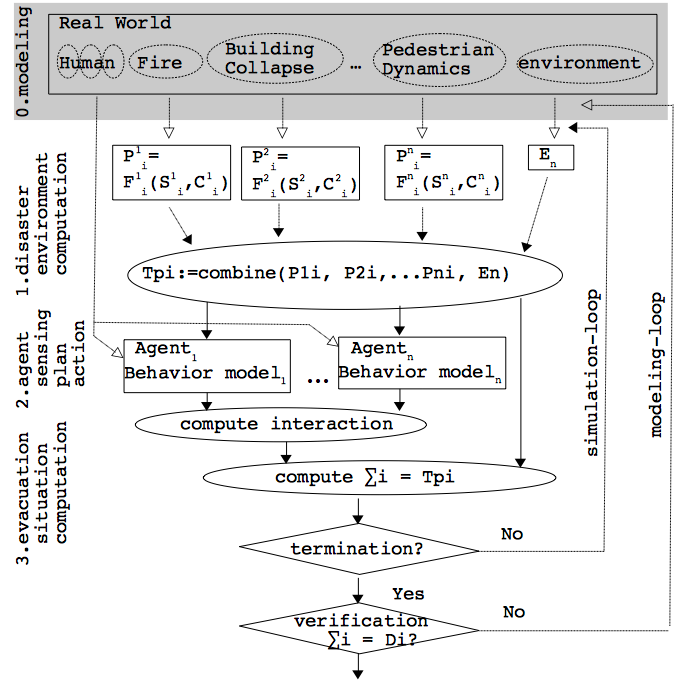
In the event of an earthquake and consequent fire, the spread of fires and the collapse of buildings, roads and other infrastructures are simulated by 𝐹1 and 𝐹𝑛, respectively. Pedestrian dynamics calculate the movements of humans in these areas. Each 𝐹 is a model of a disaster case that is derived according to the process of Figure 1. The superscript corresponds to the disaster and the subscript represents the situation. For example, even if the fires occur in the same area, the damages from the disasters are different depending on when they occur or how many people are present. The damages from 𝐹𝑖 are integrated to simulate composite disaster situations. The entanglement is based on the following hypotheses.
H1:(whole-part relation) A social system, ∑, may be composed of subsystems, 𝑆𝑖. Everyone has some knowledge on phenomena; social systems simulate this, and the knowledge is implemented in 𝑆𝑖. The model has a finite set of parameters, ∏ = {𝑝1, 𝑝2, …, 𝑝𝑛} . The parameters, 𝑝𝑖, represent features of agents, environments, and the interactions among them or others.
H2:(causality of system) The procedure followed in the system is described by formulas or rules. In the case of a discrete-time dynamic system, it can be described as ∑t+1 = 𝐹(∑t, ∏t) .
H3:(validness of system) When subsystems, 𝑆𝑖, are well defined, then the system, ∑ may be well designed and expanding or refining parameters and functions can cover more phenomena.
𝑇𝑝 which represents emergency situations that arise from various factors and human behaviors are involved in computing ∑. The result of ∑ are also compared with the precedent cases to verify the simulation results. The mitigation planning during future emergencies is formalized as finding conditions 𝑐𝑖 (related to damage) to minimize the damages by calculating 𝐹(𝑠𝑖, 𝑐𝑖) . 𝑐𝑖 and corresponding situations 𝑠𝑖 are stored as manual recipes during an emergency.
New Evacuation Guidance System to Control Crowd During Emergencies
New Guidance System to Prompt Evacuation
Many people gather to watch games, exhibitions, political rallies, and other activities. For example, millions of pilgrims visit Mecca, Saudi Arabia during the same period every year. Although careful designs and operational plans have been made to ensure safe, secure and efficient movement of people in such crowded areas, the congestion of people has resulted in several disasters (Tunasar, 2013). Crowd control is important to prevent disasters from occurring and to promote evacuation during emergencies.
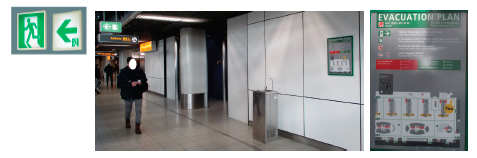
Figure 3 shows the signs that we see in
public spaces all over the world. The left picture shows exit signs (𝐸𝑆) indicating the direction of emergency
exits. The middle image shows an evacuation plan with a map on the wall.
The 𝐸𝑆 and the map are assumed to be
suitable media to prompt evacuations in public space. In 1986 and 2011,
questionnaire surveys were conducted on individuals asking, What
points do you feel anxious about in emergency situations?
, and How
do you behave when a fire occurs?
(Abe, Misumi, & Okabe, 1988; Tokyo Fire Department [TFD],
2018). Although 25 years have passed between the two studies, the
reports contain similar observations in unfamiliar places, most people
follow guidance from the public announcement (PA) system and from people
around them.
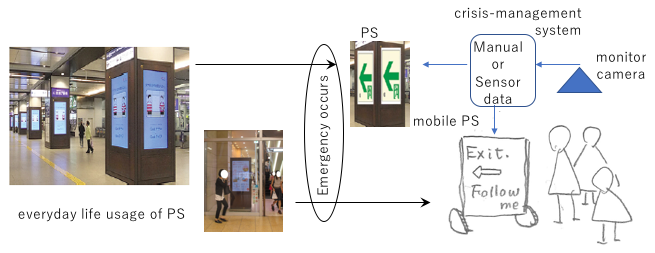
We propose a crowd control and evacuation guidance (CCEG) management system based on the knowledge obtained from these surveys. Figure 4 shows shots of promotional signage (𝑃𝑆) in everyday life (on the left). 𝑃𝑆 has recently been used for promotion and advertising in public spaces. The contents of 𝑃𝑆 change every few seconds. The right-side of Figure 4 shows an image of 𝑃𝑆 during an emergency. The CCEG system uses 𝑃𝑆 in the same way as 𝐸𝑆 during emergencies to guide people to safety. The guidance displayed on 𝑃𝑆 adaptively provides nearby people with the information to help them evacuate to safety or to control their movement as first responders guide them.
Preliminary Surveys for Validating Effectiveness of the Proposed System
People seem to move without paying attention to signs until something unexpected happens, after which their behavior becomes unpredictable. To validate the effectiveness of the proposed system, we surveyed to determine whether people sufficiently notice signs in general. Two questionnaire surveys: test A and test B. were conducted at a subway mall in 2016 (Figure 5). The mall is 300 m length long, located underground, and has fourteen exits to the surface and adjacent buildings. The exits were numbered as shown in Figure 5. The images in the top half of the figure show the inside of the mall and were taken at circled-mark points in the afternoon. The subjects of the tests were different groups of our students at our university, who were asked to walk normally to exit number 7 in the mall along the route displayed in Figure 5 on different days. At the end of the route, they were asked to recall the number and the locations of 𝐸𝑆 and digital 𝑃𝑆 that they spotted. In test A, participants were subsequently asked to retrace their path and count the number attentively; this corresponds to real emergency situations when we look for 𝐸𝑆 during evacuation. A shopping event was held while performing test B, therefore, seven more 𝑃𝑆 were displayed than there was in test A.
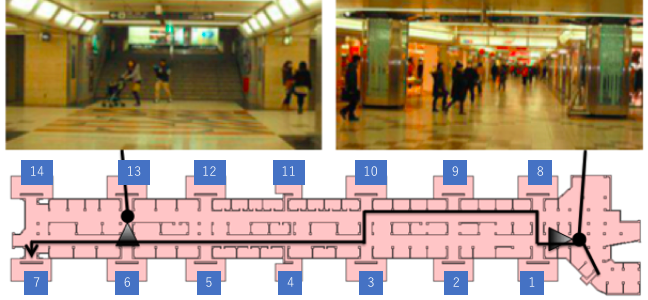
Table 1 presents the number of signs that were spotted along the route in Figure 5, and demonstrates the following:
-
People noticed at most 30% of 𝐸𝑆 when they walked unaware of these and detected about thrice the number of signs when they were attentive.
-
There was little difference in the perception rates between the proportion of 𝐸𝑆 and 𝑃𝑆 noticed.
-
People unconsciously noticed a higher proportion of 𝑃𝑆 during an unexpected event.
This indicates that 𝑃𝑆 is assumed to function as 𝐸𝑆 in an emergency and more signs can guide more people to evacuate properly.
| Test | Sign | Number of signs | Number and rate awareness | |
|---|---|---|---|---|
| Unaware (forth) | Attentive (back) | |||
|
A |
𝐸𝑆 |
36 |
9.3 (26%) |
30.8 (86%) |
|
𝑃𝑆 |
5 |
1.4 (28%) |
4.0 (80%) |
|
|
B |
𝐸𝑆 |
36 |
6.0 (16%) |
- |
|
𝑃𝑆 |
12* |
9.0 (75%) |
- |
|
Validation of Hypothesis by Simulation Results
Evacuations from the mall are simulated by an ABSS, TENDENKO (Okaya & Takahashi, 2011). TENDENKO has been developed based on RCRS and it can simulate evacuation behaviors from multistory buildings. Social force model is used to calculate human motions during the evacuation (Helbing, Farkas, Molnár & Vixsek, 2002). The rescue management office can provide information for people to evacuate through PA and signs, and agents can hear public announcements and see the signs around them. In every simulation step, the agents perceive the data around them, select an action to achieve their goal from a set of prescribed actions.
The effect of our CCEG is tested by simulating the following scenarios.
Agents evacuate initially from the exit announced by the PA. The first
message of PA is Fire near exit number 1, evacuate from exit
number 7
. This message is sent to all agents, and the agents follow
the message. As time passes, CCEG displays new information on some PAs.
The information is set suitable for dynamically changing situations, and
the message is Go to the nearest exit. The number of exit X
; the
agents within 10 m can see the message. Some of the agents change their
goal and go the exit X according to the new message, while others do not
and go to the previous goal, the exit number 7.
The International Organization for Standardization (ISO) published a technical report on occupant behavior during evacuation from a fire emergency (ISO, 2009). The technical report addresses parameters in designing for life safety and assessment the condition of occupants of the building with respect to time. The building parameters include floor layouts, warning systems, etc. The parameters of occupants are the number of occupants, their locations in the building, etc. Two basic values: available safe-escape time and required safe-escape time, which are taken by occupants to evacuate from buildings, are chosen to evaluate prevention plans against fire.
We used the evacuation rate, which shows how many people have evacuated, as a parameter to evaluate new proposals with three changing parameters:
-
𝑝 is the rate of agents who follow the guidance. We observed that some agents evacuated immediately, while others did not even though they heard the announcements of evacuation (Cabinet Office Government of Japan, 2011).
-
𝑛 is the number of people who are at the mall. Crowd density for 𝑛 = 7000 corresponds roughly to one person per 1m2.
-
𝑠 is the number of 𝑃𝑆 that is used as 𝐸𝑆 in emergencies. 𝑃𝑆 was selected in order of the amount recognized in the surveys.
The parameter, 𝑝, is implemented in the agent behavior model shown in Figure 2. When agents see new messages, they change their goal according to the messages with probability 𝑝1. The number of people and 𝑃𝑆, 𝑛 and 𝑠 are parameters of 𝛦𝑛.
Experiment 1
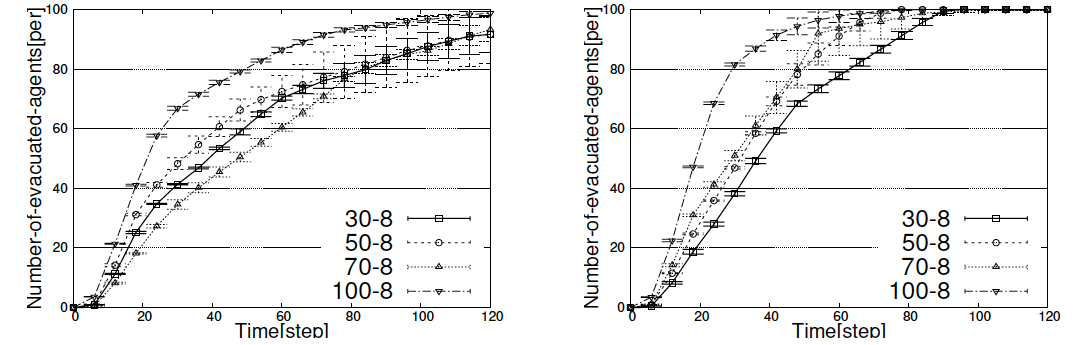
Figure 6 presents the results of simulations. The simulations were performed three times for 𝑝 = {30%, 50%, 70%, 100%}, 𝑛 = {1000,4000, 7000, 10000}, and 𝑠 = {4, 6, 8}.
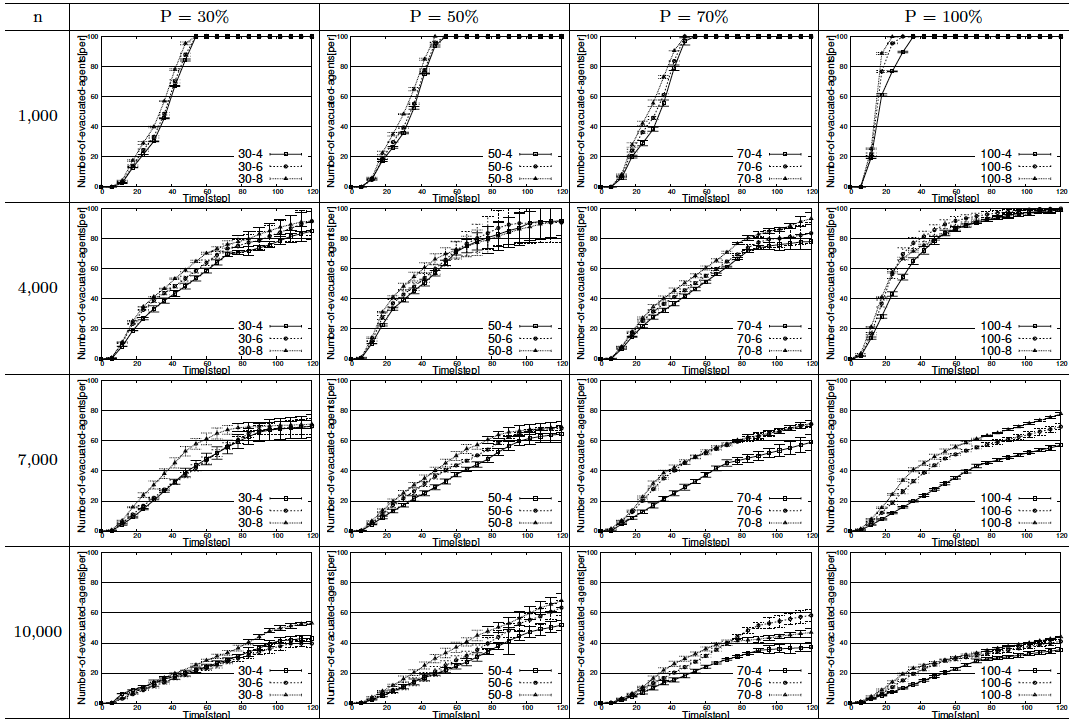
In each simulation, the behavior of the agents was recorded. The time when the agents arrived at exits and the number of agents who evacuated were calculated at each simulation time from the log files. The vertical axis of each graph is the average of evacuation rates of three simulations and the horizontal axis is simulation time. For example, about 30% of the agents evacuate at 30 time-step in a case of (𝑝, 𝑛, 𝑠) = (30%, 1000, 4) of the top left chart in Figure 6. The survey results shown in Table 1 indicated 30% of 𝐸𝑆 were recognized, the cases of 𝑝 = 30%, 𝑛 = 1000 correspond to congestions of a midweek afternoon. Hence, the case with (𝑝, 𝑛, 𝑠) = (30%, 1000, 4) was selected as a standard case.
The evacuation rate of the case with (𝑝, 𝑛, 𝑠) = (30%, 1000, 4) is 30.3 ± 2% at 30 time-step, and the 95% confidence interval of the t-test becomes from 28% to 33%. The evacuation rates at 30 time-steps for the other 15 cases with different 𝑛 and 𝑠 are outside of the confidence intervals, so they are statistically significant different among each other. Figure 6 indicates that in simulations with 𝑛 = 1000, the evacuation rate increases with 𝑝 and the number of signs 𝑠 increases. For example, approximately 90% of the agents evacuate at 30 time-steps in a case of (𝑝, 𝑛, 𝑠) = (30%, 1000, 4) of the top right chart. However, as the number of people becomes larger, this trend changes; when 𝑛 = 7000 and 10000, the evacuation rates at 𝑝 = 70% and 50% become better than at 𝑝 = 100%.
Experiment 2
By analyzing the differences in the changes of evacuation rates of Experiment 1, we found that congestion at some areas causes the change in the trend for 𝑛 = 7000 and 10000. Nowadays, security video cameras are commonplace in cities worldwide. At places where crowds of hundreds or thousands gather, such monitoring is important for safety and security purposes and human operators are generally employed for the task at large events (Moore, Ali, Mehran, & Shah, 2011). As a result, camera monitoring system could be used as a component of CCEG management system using 𝑃𝑆.
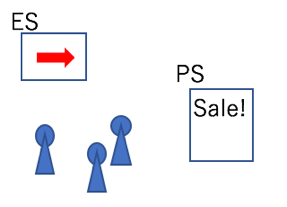
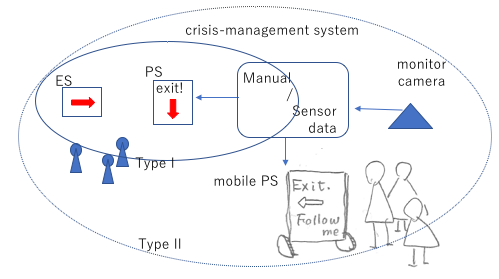
Figure 7(a) shows the present usage of 𝑃𝑆 where 𝑃𝑆 displays promotional contents; Figure 7(b) shows CCEG images of 𝑃𝑆 when 𝑃𝑆 changes its role to that of 𝐸𝑆 and displays preplanned messages during emergencies. The part circled as type I in Figure 7(b) corresponds to Experiment 1 when manuals based guidance is displayed on 𝑃𝑆. The camera monitors the behavior of people, and this case (type II) corresponds to Experiment 2 where 𝑃𝑆 displays contents suitable to current situations.
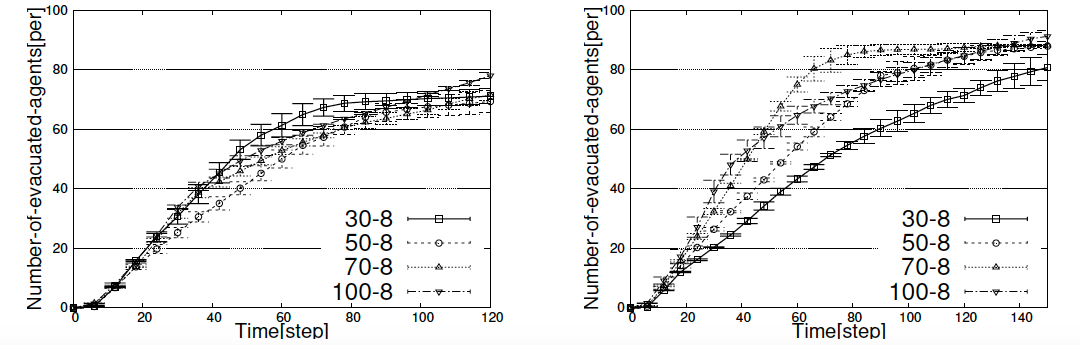
Figure 8 shows the comparison of the refuge rates between manual based guidance (experiment 1) and guidance with congestions taken into consideration (experiment 2). In the simulation of experiment 2, the following two conditions are implemented:
-
Congestions: 𝑃𝑆 agents calculate population density around them at every simulation step and check whether congestion status is over a pre-specified density value (this time 4 persons/m2).
-
Display contents: When 𝑃𝑆 agents perceive congestion status, they change their 𝑃𝑆 messages from
Go to the nearest exit. The number is X
toGo to uncrowded exit. The number is Y
. Y is determined serially by the distances from 𝑃𝑆 located in evacuating direction.
Figure 8 shows that guidance with congestion considered improves the refuge rate. The left figures are graphs from Figure 6. The right figures show graphs of experiment 2 results for the corresponding scenarios and indicate better evacuation rates. The trends of rescue rates for 𝑛 = 4000 and 7000 seem similar to the cases where 𝑛 is small.
Assessment of Simulation Results
Predictive Simulation for Rare Cases
The relationship between frequency and scale of social events is said to follow the power law. Gutenberg–Richter law in seismology expresses the relationship between the magnitude and total number of earthquakes in any given region and time period. It means that there is little data to prove the effect of prevention plans for future disasters, where the size could be larger than what we expect at present. As it would require substantial recourse to prepare for such incidents, it is hard to make sufficient prevention plans. Once it happens, such conditions may cause more damages than the ones prepared for2. This means disaster simulations should be well designed to present the behavior of targets and the features of fields when the results are used in policy or decision making. We need to know that the results are guaranteed to be reasonable ones for all scenarios even if they are new scenarios that have not been seen before.
In crowd evacuation simulations, verification and validation of the simulation tools and results have been one of the most important issues. Lovreglio et al. presented an evacuation model for experimental and simulation data in the field of fire evacuation that are influenced by a component of uncertainty in human behavior (Lovreglio, Ronchi, & Borri, 2014). The following questions arise from the test methods that are suggested from quantitative/qualitative attributes of points for behavioral uncertainty essential to ABSS applied to social simulations (Averill, Mileti, Peacock, Kuligowski, & Groner, 2005).
Q1. How do we judge if a tool is accurate enough?
Q2. Which tests and how many should be performed to assess the accuracy of the model predictions?
Q3. Who should perform the tests, i.e., the model developers, the model users, or a third party?
These questions need to be answered to users who will employ the simulation results in their decisions.
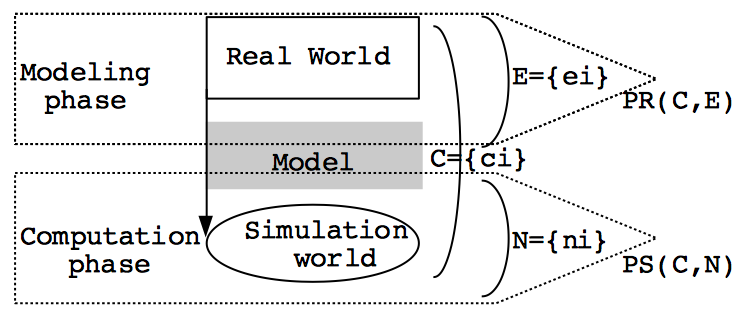
In addition, studies point out that the questions are applied in the field of the first class of applications, which are calculated with physical laws and two kinds of errors appear in simulations (Kikuuwe, 2016). The first type of error is associated with the modeling process and the second type is associated with the computations involved in the model; the process is formulated such that an occurrence in 𝑃𝑆(𝐶, 𝑁), one simulation results, is involved in 𝑃𝑅(𝐶, 𝐸) where 𝐶 = {𝑐𝑖} , 𝐸 = {𝑒𝑖} , and 𝑁 = {𝑛𝑖} (Figure 9); 𝑐𝑖 are parameters that users can control, 𝑒𝑖 are parameters that users do not notice or cannot specify, 𝑛𝑖 are parameters that are introduced in the process of simulations, such as numerical errors and distributed computations.
In calculating of some occurrences in 𝑃𝑆(𝐶, 𝑁), we accept the calculations as correct when their behaviors agree with our intuitions or are within probability laws. For example, think of Buffon's Needle, the dropped positions are different at every trial in real world and the prediction of the positions are taken to be correct when they follow law of great numbers instead of specifying all 𝑐𝑖 to fit the calculation within some errors. In the field of computer graphics, the idea of a plausible simulation presents such situations (Barzel, Hughes, & Wood, 1996).
The plausible idea is applied to the second and the third classes of applications where there is little or no precedent. The questions on the results of ABSS in social fields need to be specified more quantitatively. Q1 states necessary conditions where simulation results are applied in practical ways and implies that situations that have occurred in the past should be simulated with the model by setting parameters properly. Q2 refers to potential applications of evacuation simulations. By setting different parameters within a range of reasonable deviation, some simulations may show results beyond expectations. When we recognize that the cases may occur, the results may caution us about unintended damages. Q3 indicates that the concerned parties may evaluate the results with conflicting factors to make prevention plans3.
Qualitative Analysis
The followings are our proposed qualitative standards (QS), irrespective of whether the simulations are applied to fields with little or no real-world data. The situations are compatible with plausible simulation (Takahashi, 2015):
QS1: (Consistency with data) The simulation results of fields without corresponding data or its variations after changing parameters or modifying subsystems are compatible with past anecdotal reports.
QS2: (Generation of new findings) The results involve something that was not recognized as important before the simulations but is reasonable given empirical rules.
QS3: (Accountability of results) The causes of the changes can be systematically explained from the simulation data.
Table 2 shows the relation between Qs and QSs and indicates that Qs and QSs cover each other conditions that are needed to apply social simulations to real applications.
| QS1 | QS2 | QS3 | |
|---|---|---|---|
|
Q1 |
Accuracy leads to consistency of precedents. |
Incidents in simulations give plans to make for unexpected cases. |
|
|
Q2 |
Prediction simulation supports making plans for unexpected cases. |
Effect and cause are presented visibly. |
|
|
Q3 |
Simulations are estimated from different metrics. |
Changes in results imply scope of planning. |
Using the simulation results of experiments 1 and 2, the effects in our CCEG are validated from viewpoints of QSs:
-
The number of 𝑠 is related to evacuation guidance information. In every case, more information on exits increases evacuations rates. Simulations for 𝑛 = 1000 and 4000 show the evacuation rates increase as 𝑝 increases; the increased rates are consistent with our knowledge on crowd behaviors.
-
In some cases of 𝑛 = 7000 and 10000, the evacuation rates do not necessarily increase as 𝑝 increases. The decrease is caused by the congestion in some areas, and it is shown the information adaptively guided to the crowd status lead people to evacuate smoothly.
-
Changing guidance dynamically according to the situation improve the evacuation rate.
The first and second points refer to consistency with the data and new findings and accountability. The third point shows the possibilities of our proposed CCEG. From them, the simulation results show that CCEG will provide effective guidance to people during emergency situations.
Summary
With the growth of technology, the ways we access information and provide data have been changing, and new media will affect human behaviors during emergencies in different ways that we assume at present. Systems adapting new technologies to prevent the emergencies are becoming outside of the scope of traditional methods of verification. To apply the new technology to real application, some criteria are required. The validation technique and related themes of simulating social incidents have been discussed; however, many validation ways of simulations are based on comparison with real or experimental data (Heath, Hill, & Ciarallo, 2009). Comparing with data is essential in the fields of the first class applications, but for the fields of the second and the third classes, where there are little data and it is difficult to perform experiments, alternative validation methods are required.
In this paper, a CCEG management system was proposed based on the surveys on 𝐸𝑆 and 𝑃𝑆. 𝑃𝑆 is a new device and is thought to show the same effect as 𝐸𝑆 during emergency. 𝑃𝑆's effect of evacuation rate was simulated by ABSS and the validating ways of assessing the adoption of new technology were discussed. This validation provides an example to assess simulations in the fields of the second and third classes of applications that involves human behaviors, and acts as an explanatory data for adopting of new technology against future disasters.
Acknowledgements
This work was supported by JSPS KAKENHI Grant Number 16K01291.
Footnotes
- We calculate a uniform random number for each agent. When the random number is smaller than 𝑝, the agents change the goal to the new one. This process and the way in which each agent is implemented as a thread cause stochastic factors in simulations.[back]
- According to WHO, insufficient capacity of response for hazard situations is one component to cause disaster (WHO, 2002).[back]
- For example, in the Great East Japan Earthquake, the power-supply unit of Fukushima Nuclear Plant was damaged by the 15m high tsunami, which caused the serious accidents. Owing to cost and the very small probability of a 15m high tsunami, Tokyo Electric Power Company (TEPCO) had earlier built a breakwater of 6.1m and not 15m even though they knew the possibility of the occurrence (Tokyo Electric Power Company [TEPC], 2018).[back]
Bibliography
- Abe, K., Misumi, F., & Okabe, K. (1988). Behavior Science at Natural Disasters (in Japanese). Tokyo, Japan: Fukumura Shuppan.
- Averill, J.D., Mileti, D.S.,
Peacock, R.D., Kuligowski, E.D., & Groner, N.E. (2005). Occupant
Behavior, Egress, and Emergency Communications (Draft) (Report No. NIST NCSTAR 1–7). Gaithersburg, MD: National Institute of Standards and Technology.

- Barzel, R., Hughes, J., &
Wood, D. (1996). Plausible Motion Simulation for Computer Graphics
Animation. In R. Boulic, & G. Hégron Computer Animation and
Simulation '96 (pp. 183–197). New York, NY: Springer Wien.

- BBC News (2015, 11 30). Woman
Dies after 'Terror Drill' at Kneya's Strathmore University. BBC
News.

- Cabinet Office Government of
Japan (2011). Prevention Disaster Conference, the Great West Japan
Earthquake and Tsunami. Report on Evacuation Behavior of People. Cabinet Office Government of Japan.

- Faraday, M. (1848). The Chemical
History of a Candle. Free ebooks - Project Gutenberg.
- Federal Highway Administration
(2007). Managing Pedestrians during Evacuation of Metropolitan
Areas. Washington, D.C.: U.S. Department of Transportation.
FHWA-HOP-07-066.
- Feynman, R. (1967). The Character of Physical Law. Cambridge, MA: The MIT Press.
- Hahn, H.A. (2013). The Conundrum
of Verification and Validation of Social Science-Based Models. Procedia Computer Science, 16, 878–887.
- Hawe, G., Coates, G., Wilson,
D., & Crouch, R. (2012). Agent-Based Simulation for Large-Scale
Emergency Response: A Survey of Usage and Implementation. ACM
Computing Survey, 45(1), 8:–8:51.
- Heath, B., Hill, R., &
Ciarallo, F. (2009). A Survey of Agent-Based Modeling Practices (January
1998 to July 2008). Journal of Artificial Societies and Social
Simulations, 12(4), 9.
- Helbing, D., Farkas, I.J.,
Molnár, P., & Vixsek, T. (2002). Simulation of Pedestrian Crowds in
Normal and Evacuation Situations. In Pedestrian and Evacuation
Dynamics (pp. 21–58). Berlin: Springer-Verlag Berlin Heidelberg.
- ISO (2009). Fire-Safety
Engineering - Technical Information on Methods for Evaluating Behaviour
and Movement of People. International Organization for
Standardization.
- Jennings, N. (1999).
Agent-Based Computing: Promise and Perils. In Proceedings of
the Sixteenth International Joint Conference on Artificial
Intelligence (pp. 1429–1436). Stockholm: Morgan Kaufmann.
- Kikuuwe, R. (2016). Fundamental
Problems Regarding Physics Simulators: From the Perspective of Relations
among Reality, Model, and Simulator. Journal of the Robotics
Society of Japan, 34(6), 374–377.
- Kitano, H., Tadokoro, S., Noda,
I., Matsubara, H., Shinjou, A., & Shimada, S. (1999). RoboCup
Rescue: Search and Rescue in Large-Scale Disasters as a Domain for
Autonomous Agents Research. In Systems, Man, and Cybernetics,
1999. IEEE SMC '99 Conference Proceedings. 1999 IEEE International
Conference on (p. 739–743). IEEE Press.
- Lovreglio, R., Ronchi, E.,
& Borri, D. (2014). The Validation of Evacuation Simulation Models
through the Analysis of Behavioural Uncertainty. Reliability
Engineering and System Safety, 131, 166–174.
- Moore, B., Ali, S., Mehran, R.,
& Shah, M. (2011). Visual Crowd Surveillance through a Hydrodynamics
Lens. Communications of the ACM, 54(12), 64–73.
- Okaya, M., & Takahashi, T.
(2011). BDI Agent Model Based Evacuation Simulation. In The
10th International Conference on Autonomous Agents and Multiagent
Systems - Volume 3 (pp. 1297–1298). Richland, SC: International
Foundation for Autonomous Agents and Multiagent Systems.
- Song, X. (2016). Selfishness-
and Selflessness-Based Models of Pedestrian Room Evacuation. Physica
A: Statistical Mechanics and its Applications, 447, 455–466.
- Song, X. (2017). Effect of
Authority Figures for Pedestrian Evacuation at Metro Stations. Physica A: Statistical Mechanics and its Applications, 465, 599–612.
- Takahashi, T. (2009). RoboCup Rescue: Challenges and Lessons Learned. In Multi-Agent Systems Simulation and Applications (pp. 423–450). Boca Raton: CRC Press.
- Takahashi, T. (2015).
Qualitative Methods of Validating Evacuation Behaviors. In H.Takayasu,
N.Ito, I.Noda, & M.Takayasu Proceedings of the
International Conference on Social Modeling and Simulation, plus
Econophysics Colloquium 2014 (pp. 231–242). Cham: Springer.
- Tokyo Electric Power Company
(2018, April 10). Earthquake and Tsunami Attacked Fukushima
Nuclear Plant (in Japanese).
- Tokyo Fire Department (2018,
January 20). Fire Evacuation Simulation at Big Terminal Station
(in Japanese).
- Tunasar, C. (2013). Analytics
Driven Master Planning for Mecca: Increasing the Capacity while
Maintaining the Spiritual Context of HAJJ Pilgrimage. In Proceedings
of the 2013 Winter Simulation Conference: Simulation: Making Decisions
in a Complex World (pp. 241–251). Piscataway, NJ: IEEE Press.
- World Health Organization
(2002). Disaters & Emergencies Definitions. Adis Ababa:
WHO/EHA.
Copyright Information
 Copyright © 2018 Tomoichi Takahashi. This article is licensed under a Creative Commons Attribution 4.0 International License.